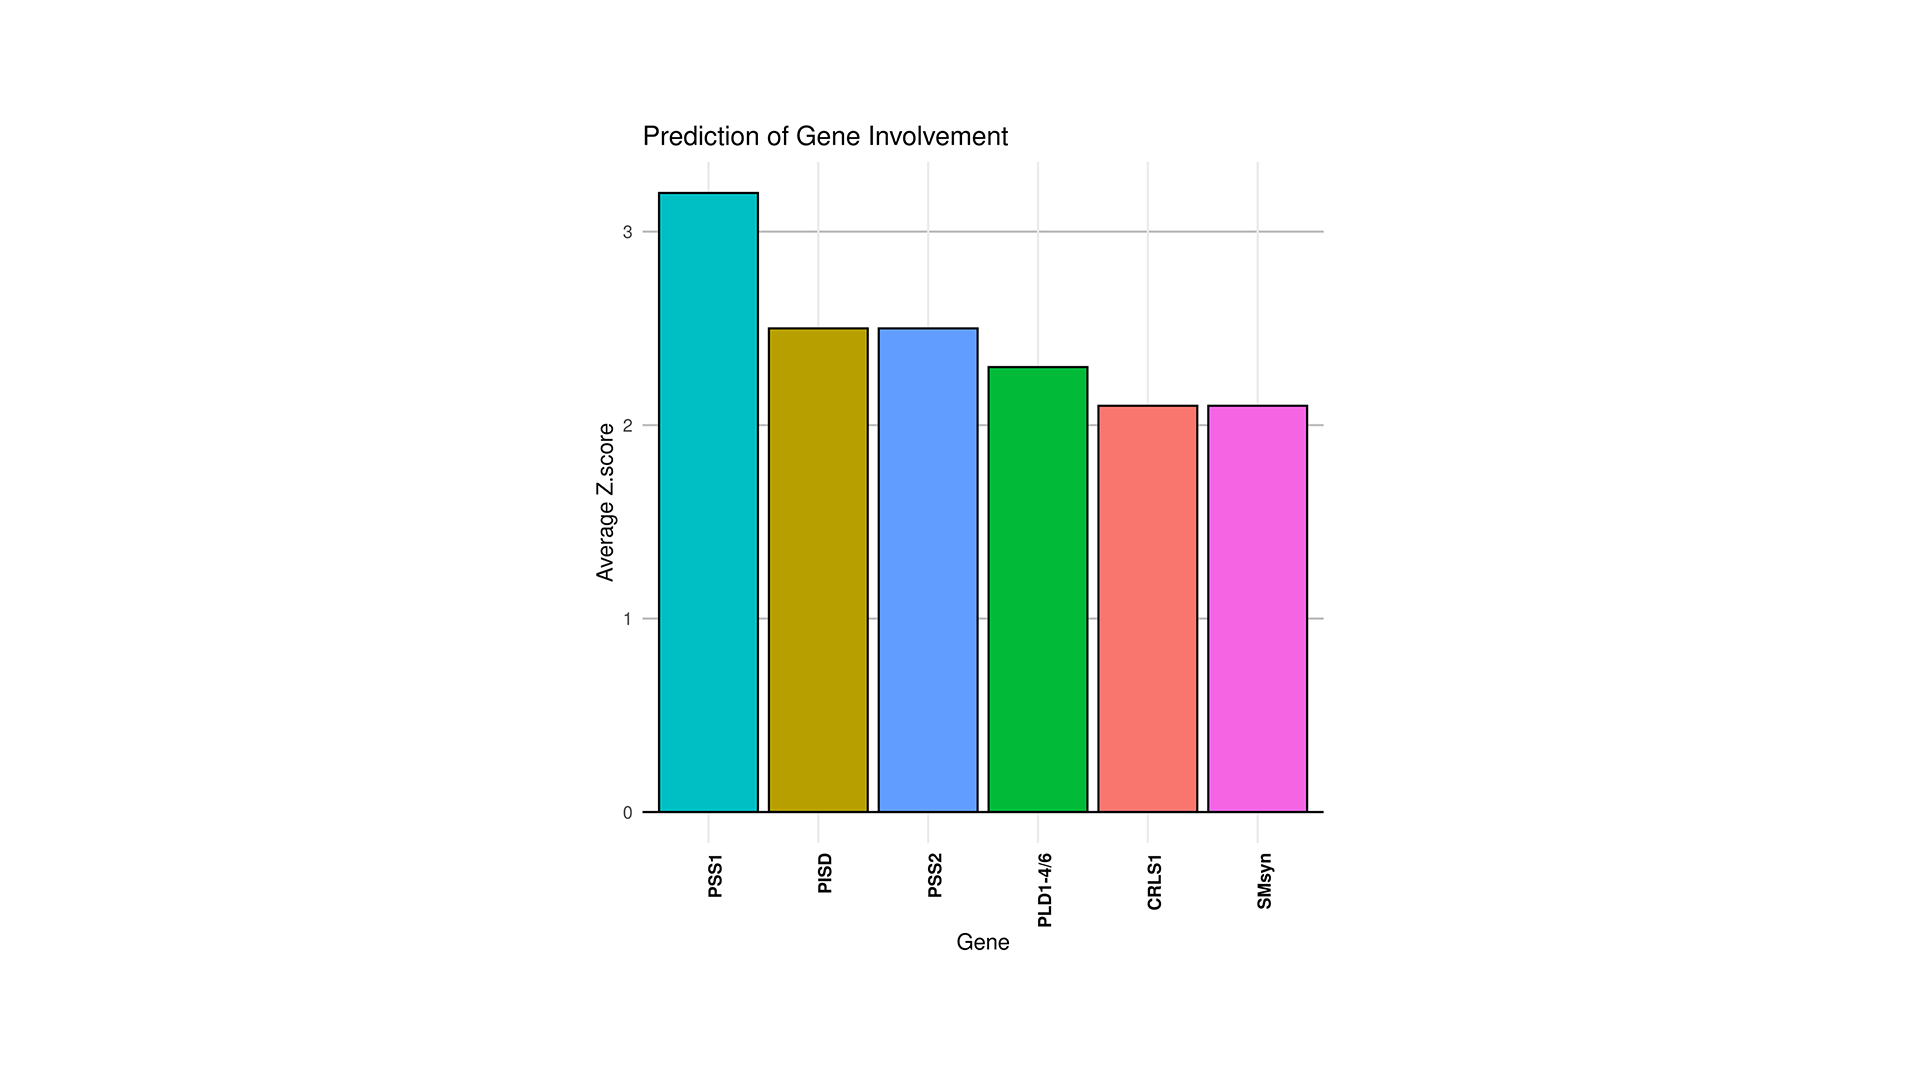
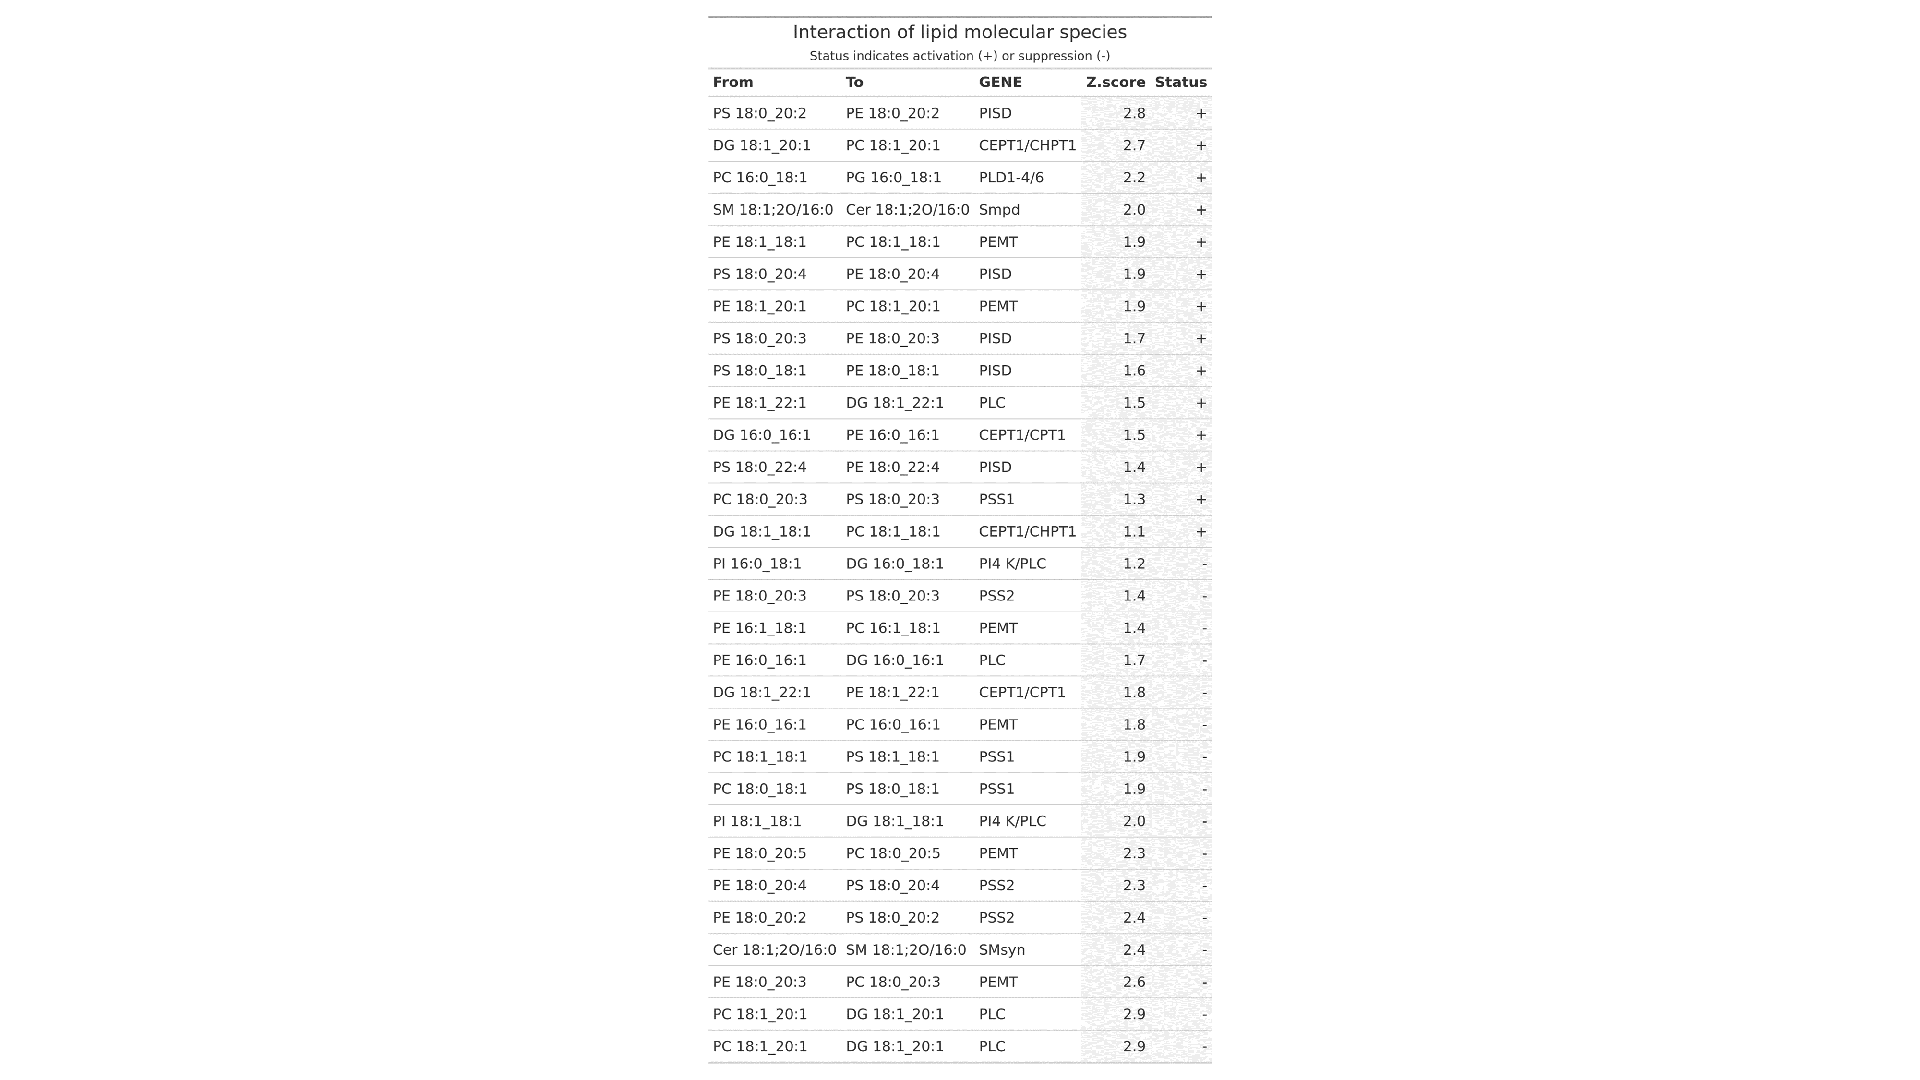
Here you can explore your lipidomic data, discover biomarkers, predict genes involved in transformations between control and experiment groups, and study lipidomic pathways.
Welcome to LipidOne 2.4

User-friendly lipidomic data analysis tool
for a deeper interpretation
in a systems biology scenario
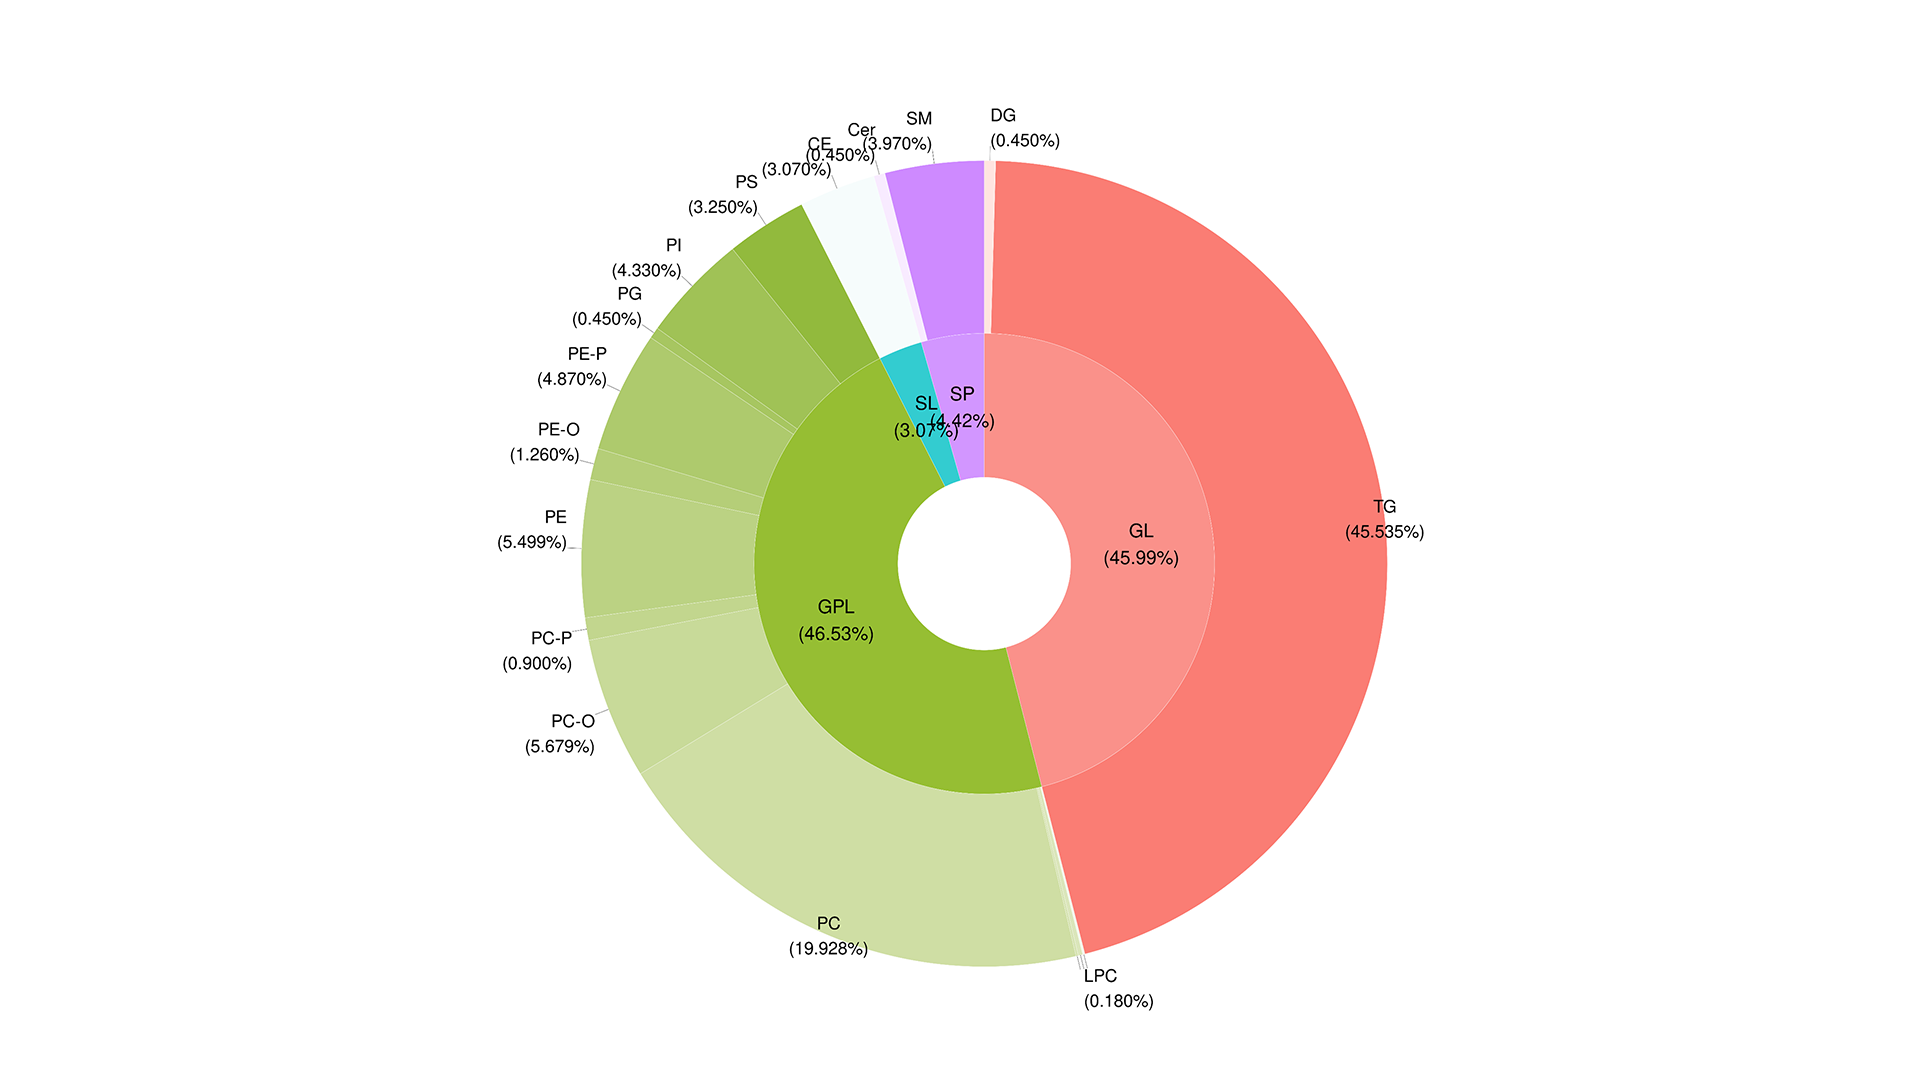
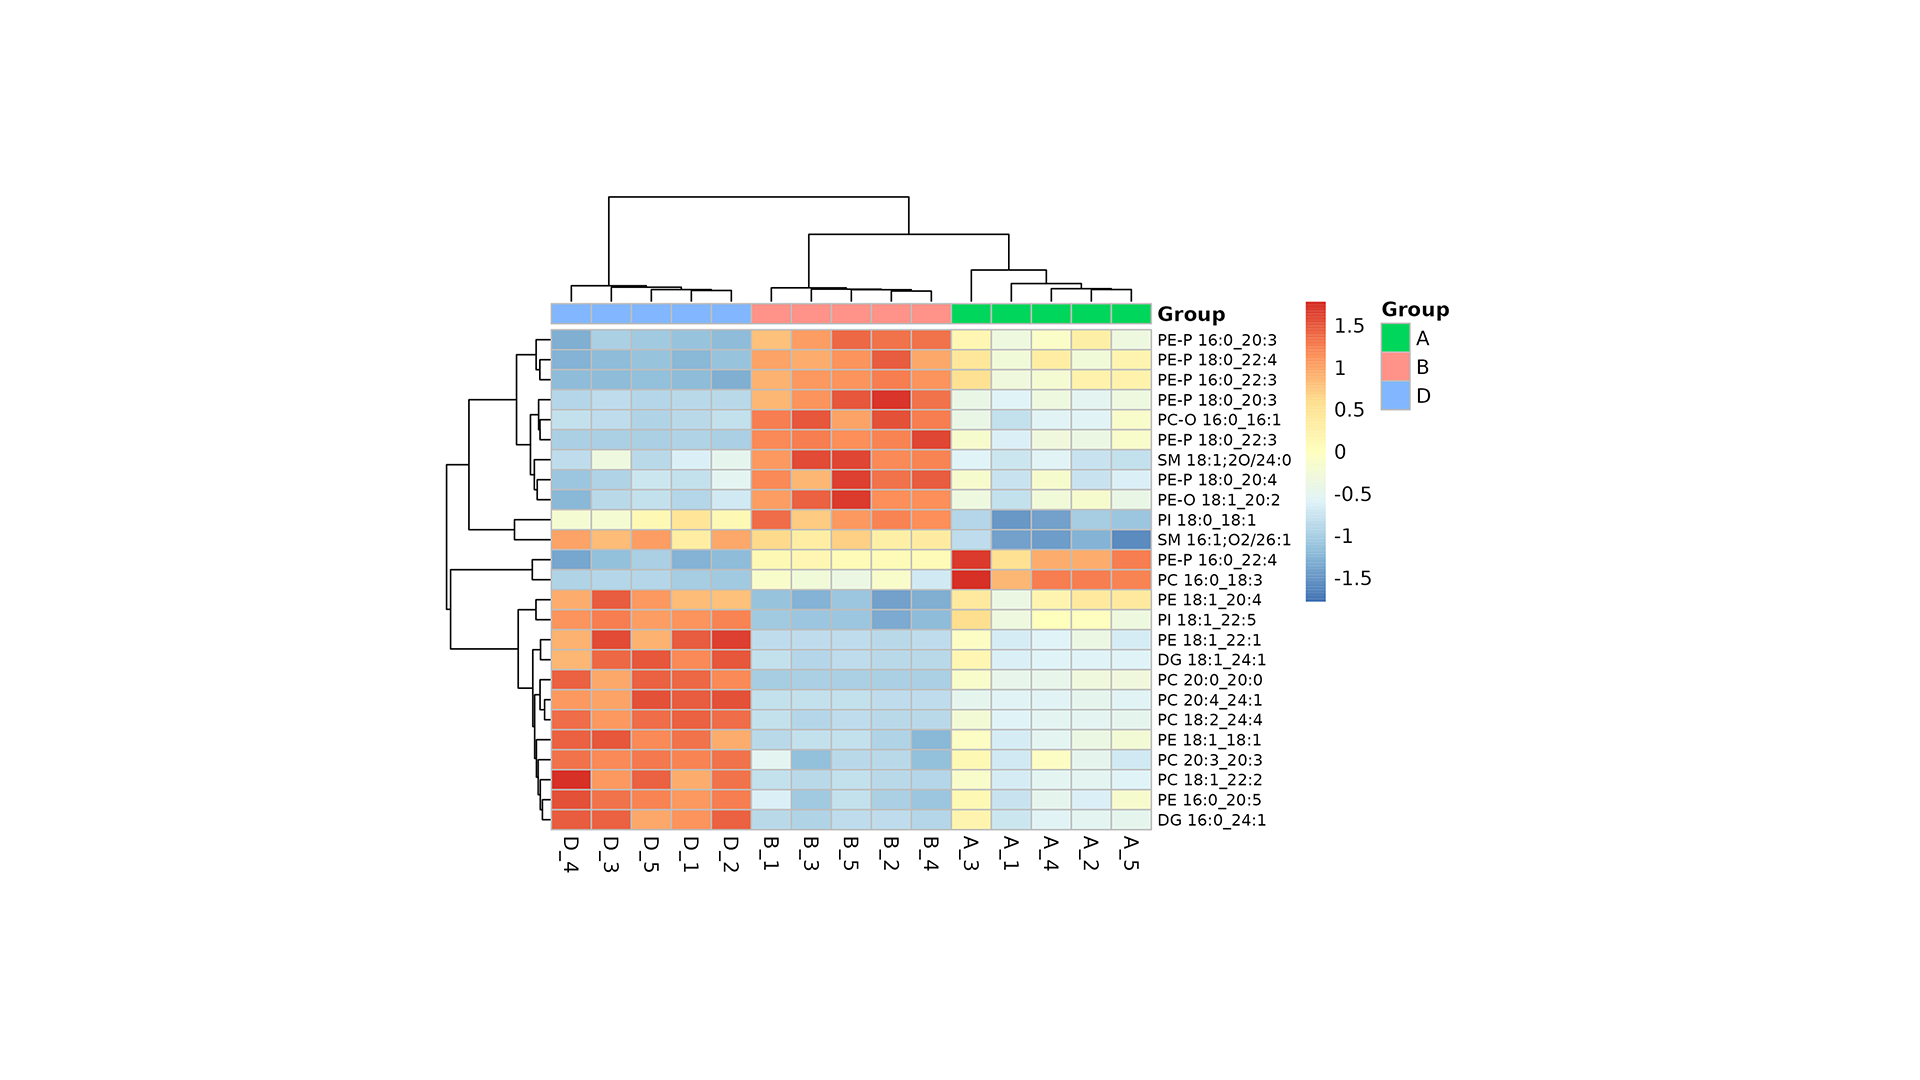
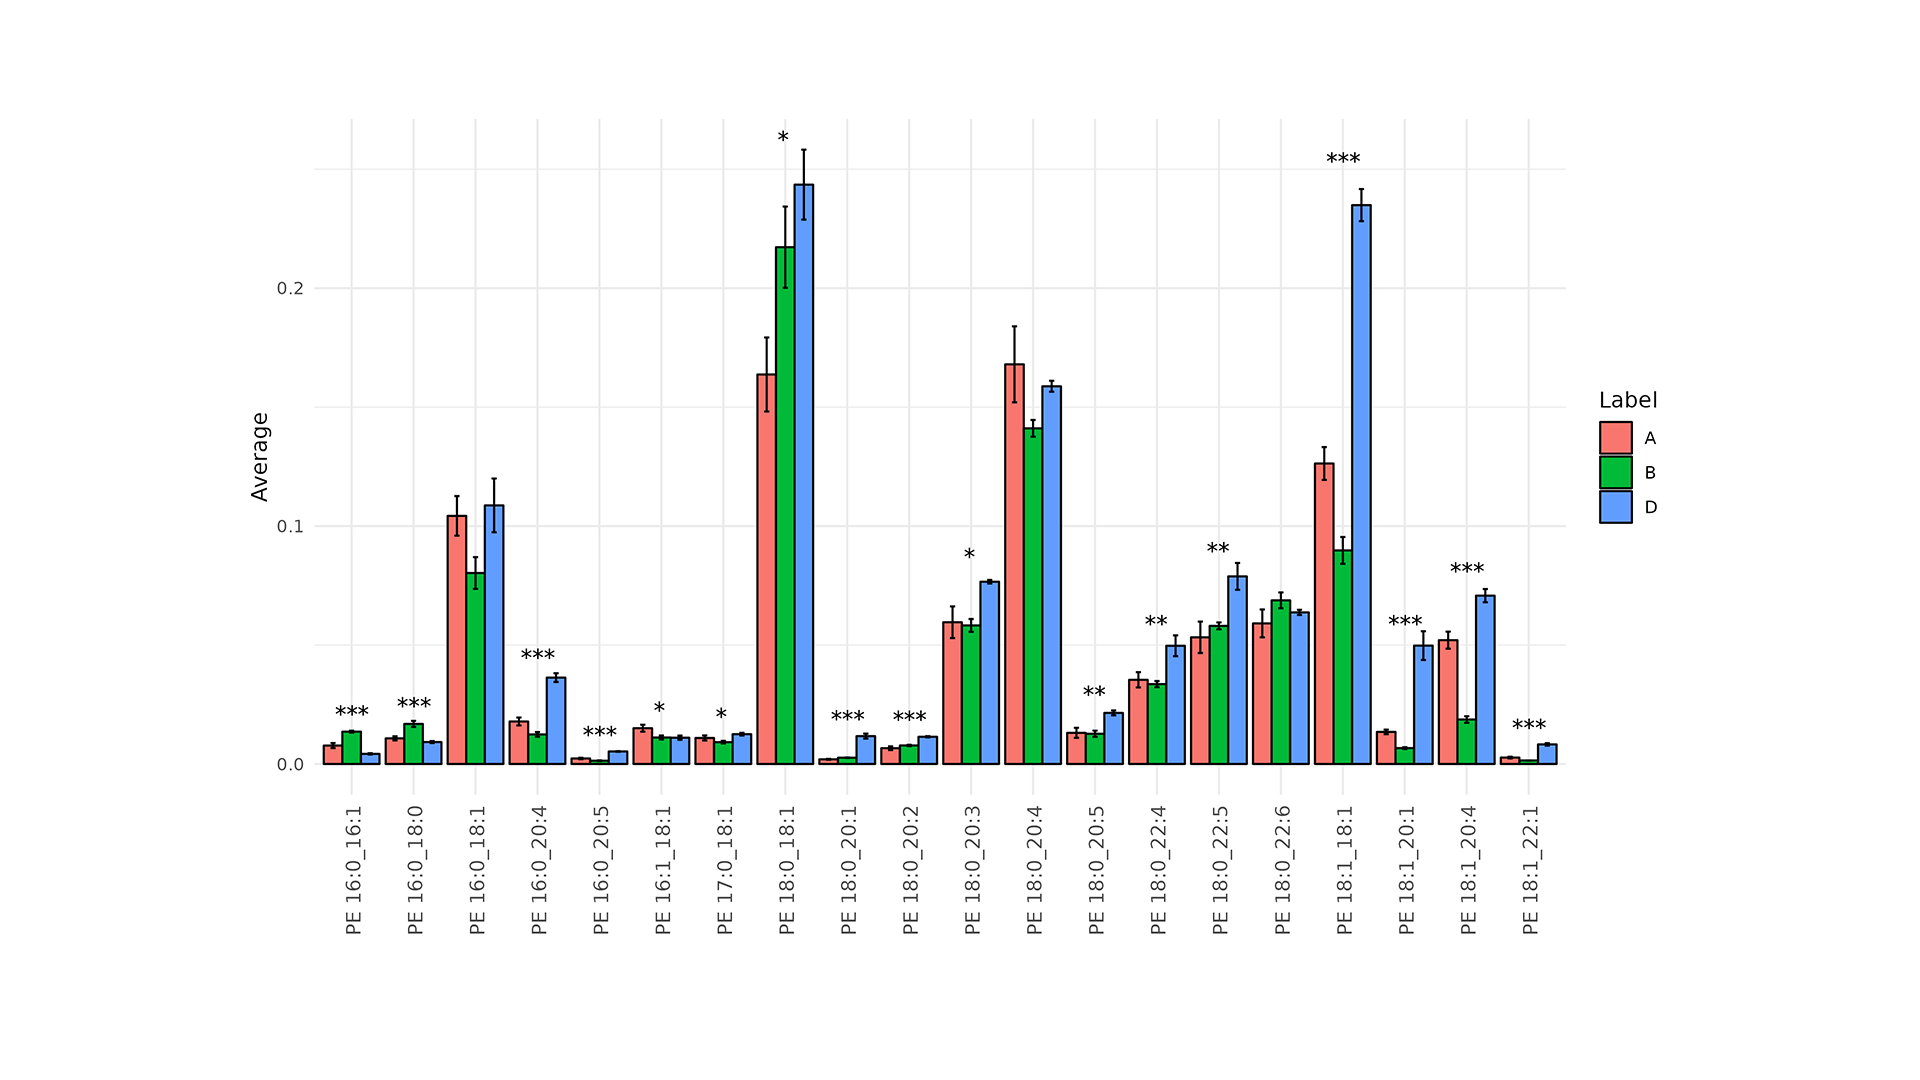
Analyses are possible on three levels: Lipid Classes, Lipid Molecular Species, Lipid Building Blocks.
LipidOne 2.4 provides you with single and multivariate, supervised and unsupervised statistical analysis tools.
Furthermore, you can always select groups and classes and work on subsets of your data.
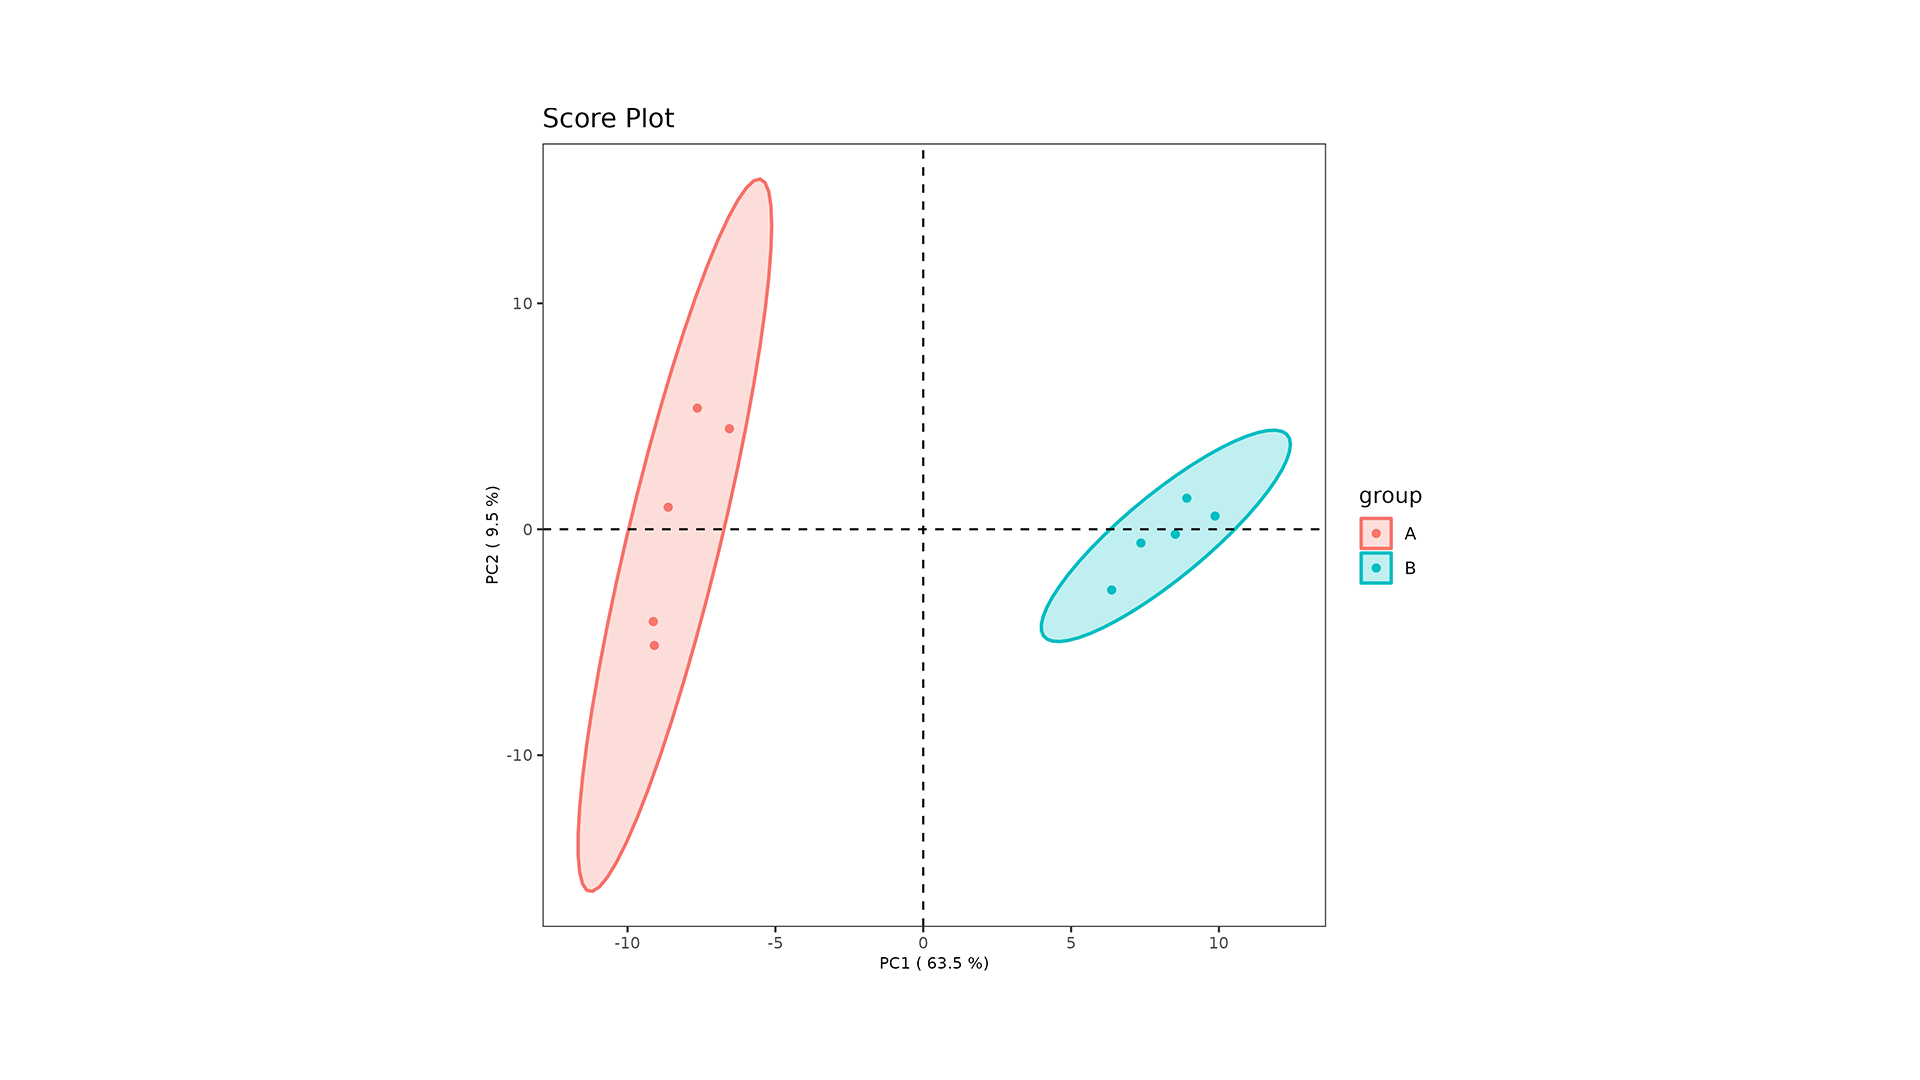
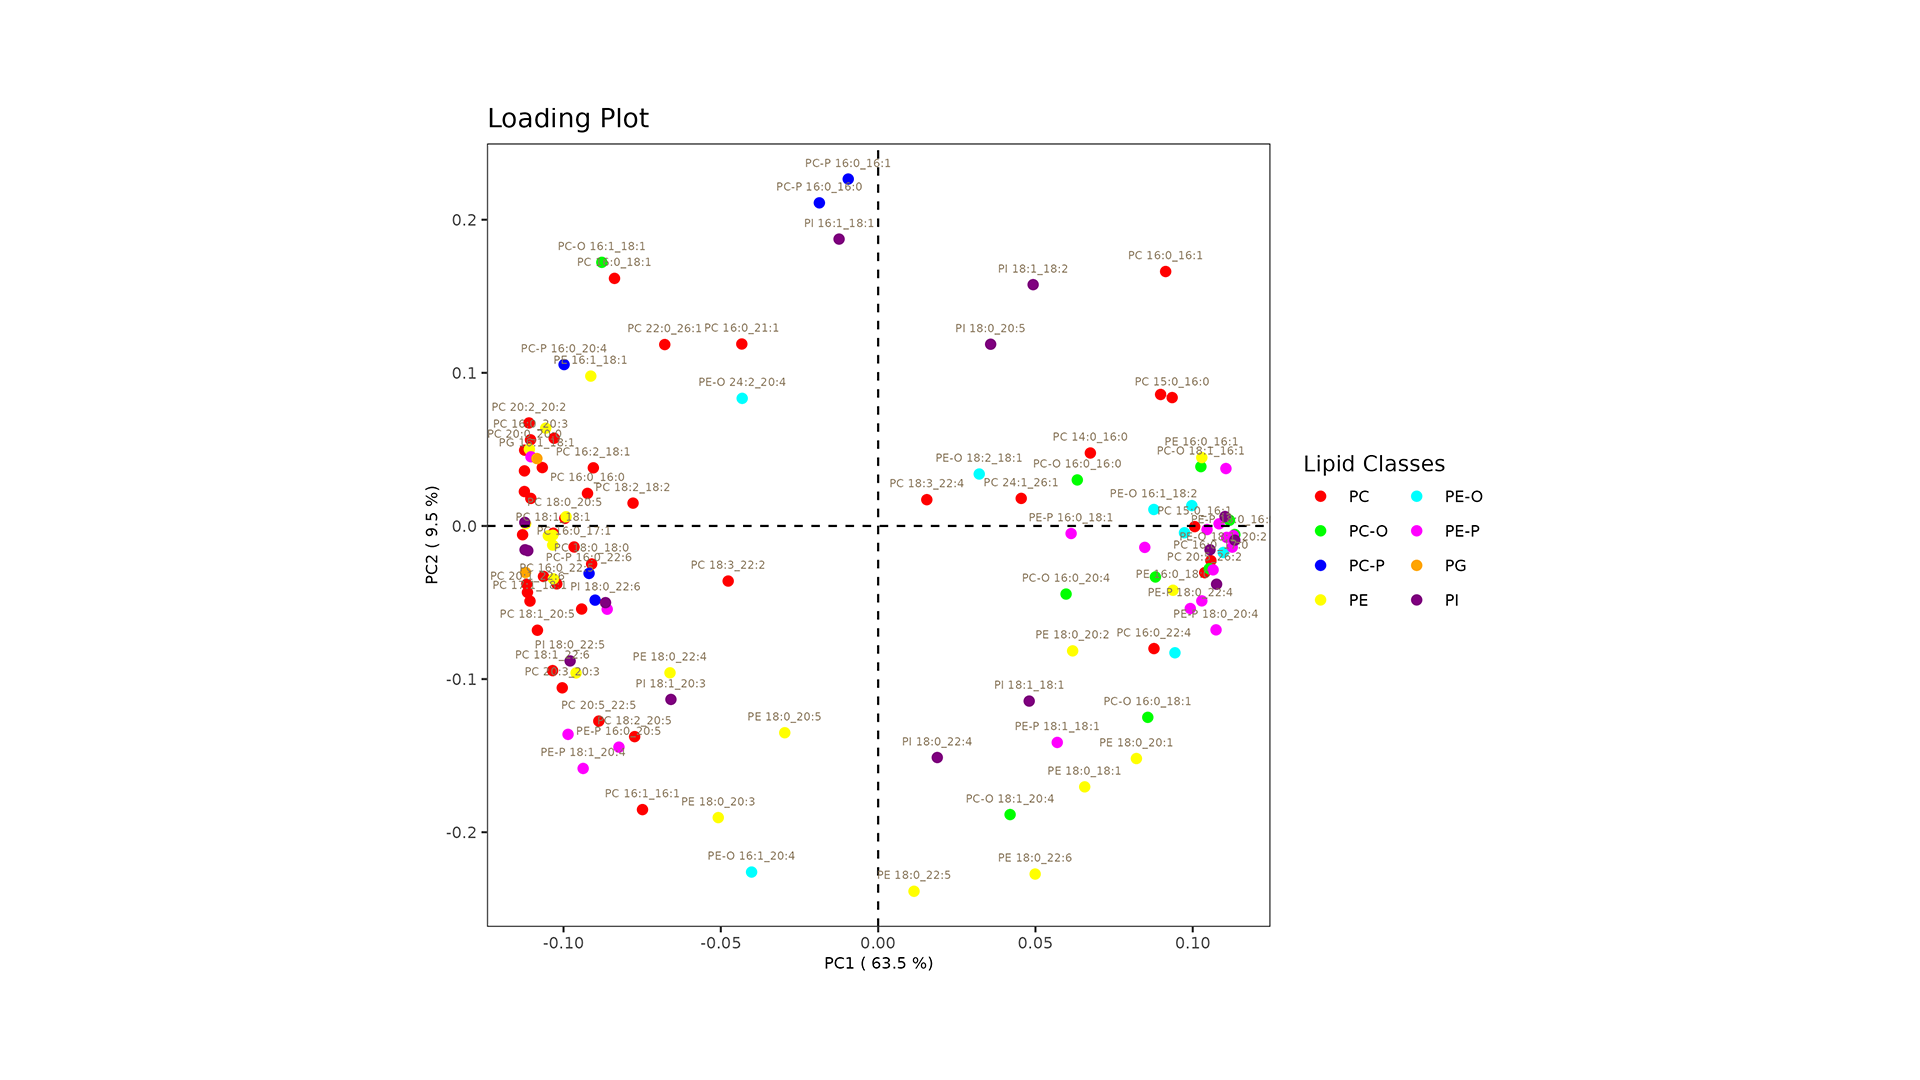
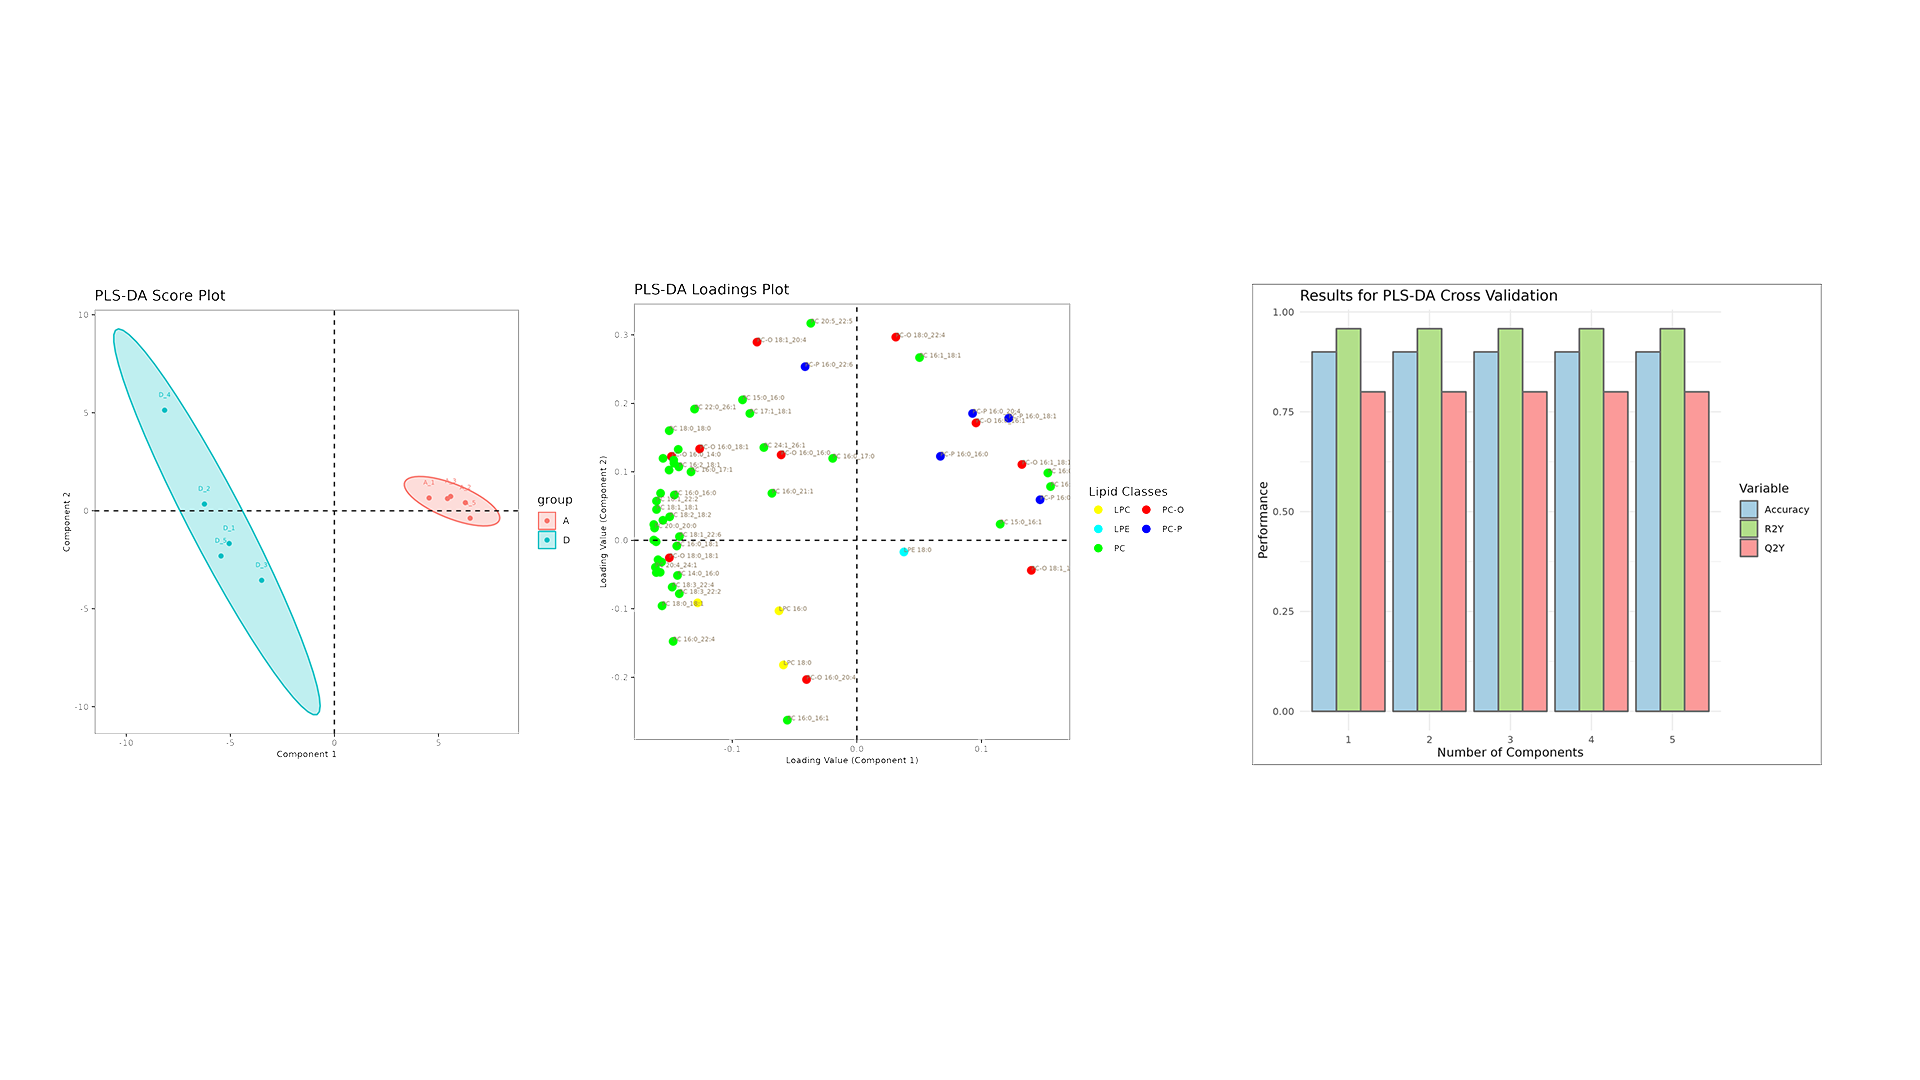
LipidOne performs PLS-DA analysis, generating multiple visualizations for model interpretation:
- Score Plot: Displays sample separation across components, highlighting group clustering and variance.
- Loading Plot: Identifies key lipid variables contributing to group differentiation.
- VIP Score Plot with Heatmap: Ranks the top 20 most influential lipid species (VIPs) and visualizes their expression patterns.
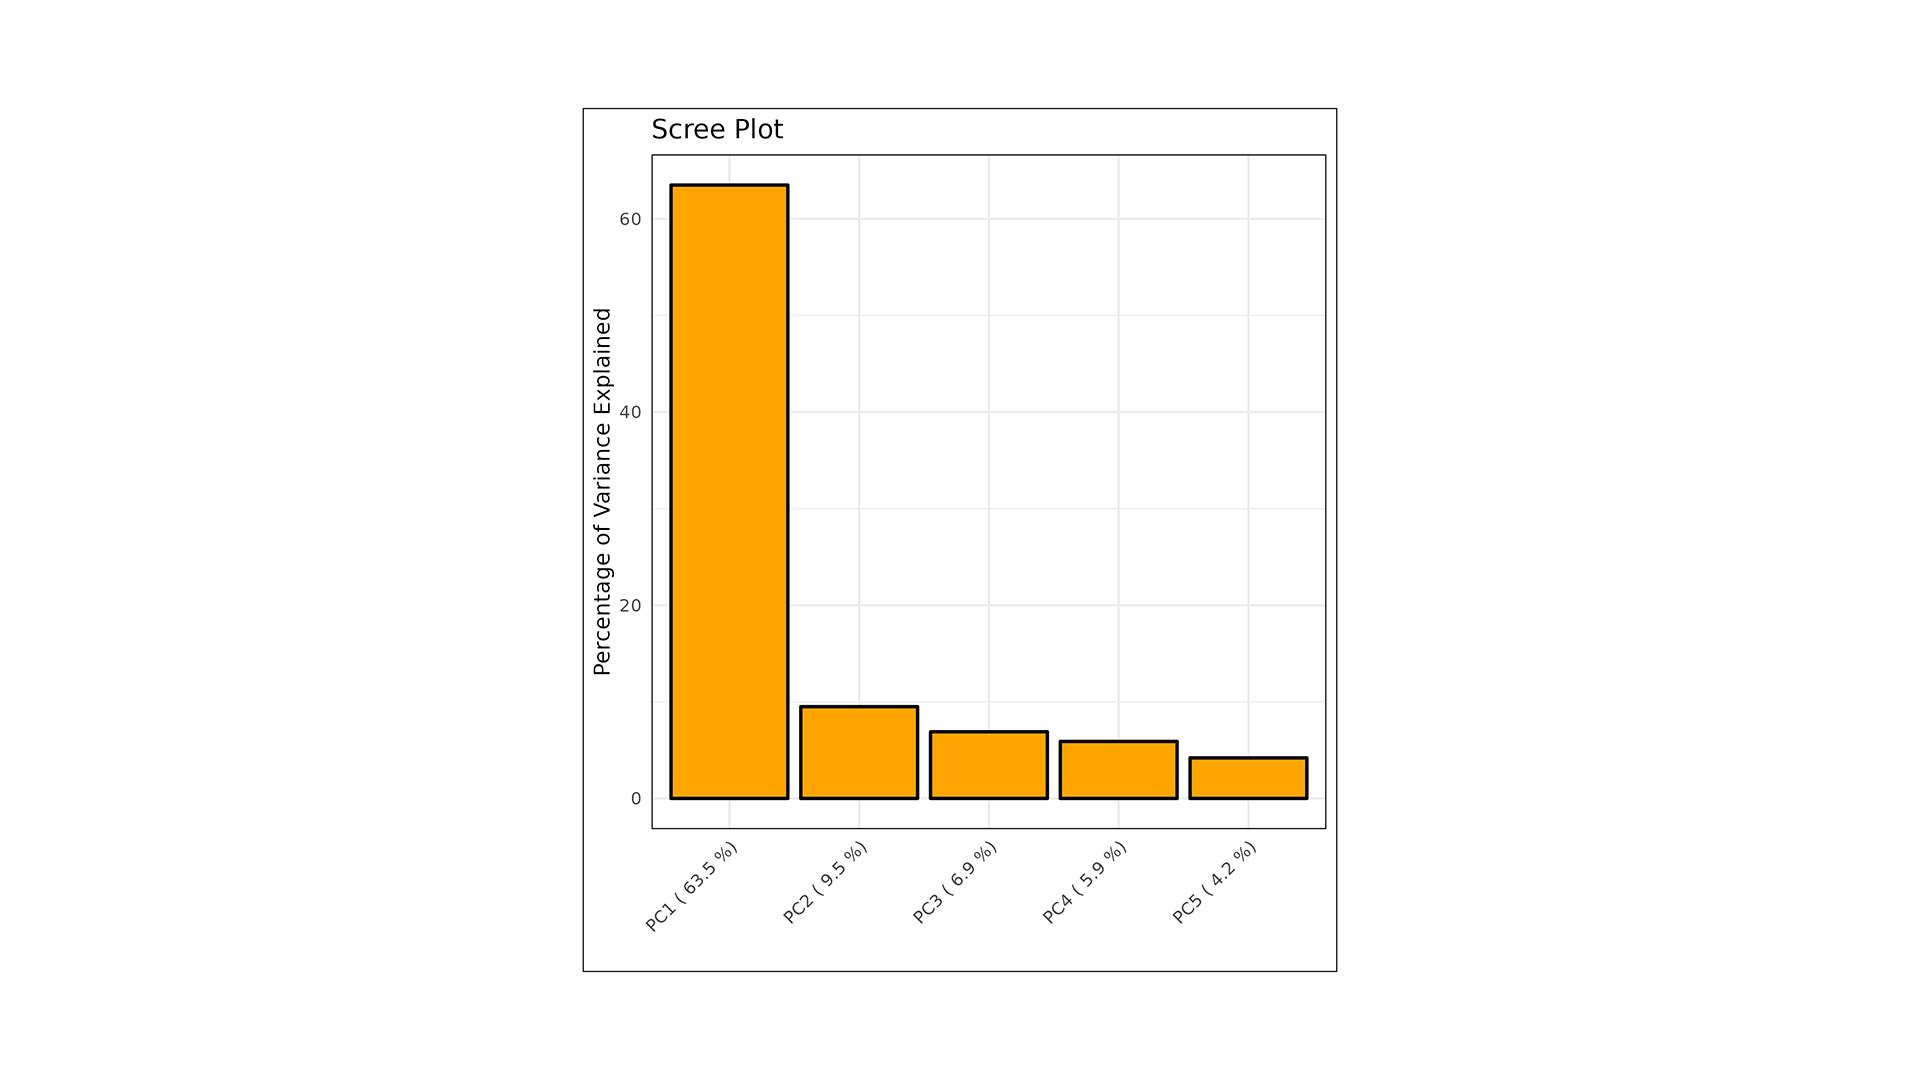
- R2Y, Q2Y, and Accuracy Plot: Evaluates model performance and predictive ability across components.
- Confusion Matrix: Assesses classification accuracy by comparing predicted vs. actual sample groups.
LipidOne performs sPLS-DA analysis, generating multiple visualizations to enhance model interpretation and feature selection:
- Score Plot: Shows the separation of groups based on sparse latent components.
- VIP Score Plot with Heatmap: Highlights the top 15 most discriminant lipid species and their expression patterns.
- Performance Evaluation Plot: Assesses classification performance based on the number of selected variables using different distance metrics.
- Error Rate Plot: Displays classification error rates across components and distance metrics.
- Confusion Matrix: Evaluates classification accuracy by comparing predicted vs. actual groups.
LipidOne performs OPLS-DA analysis, generating multiple visualizations for model interpretation and validation:
- Score Plot: Displays group separation by removing orthogonal variation, enhancing discrimination.
- VIP Score Plot with Heatmap: Identifies the top 20 most discriminant lipid species and their expression trends.
- Observation Diagnostics Plot: Detects potential outliers based on orthogonal and score distances.
- S-Plot: Highlights key lipid features contributing to group differentiation.
- Permutation Tests (R2Y and Q2Y): Validates model robustness by comparing actual vs. permuted data.
- Model Performance Plot: Summarizes predictive ability using R2X, R2Y, and Q2 values.
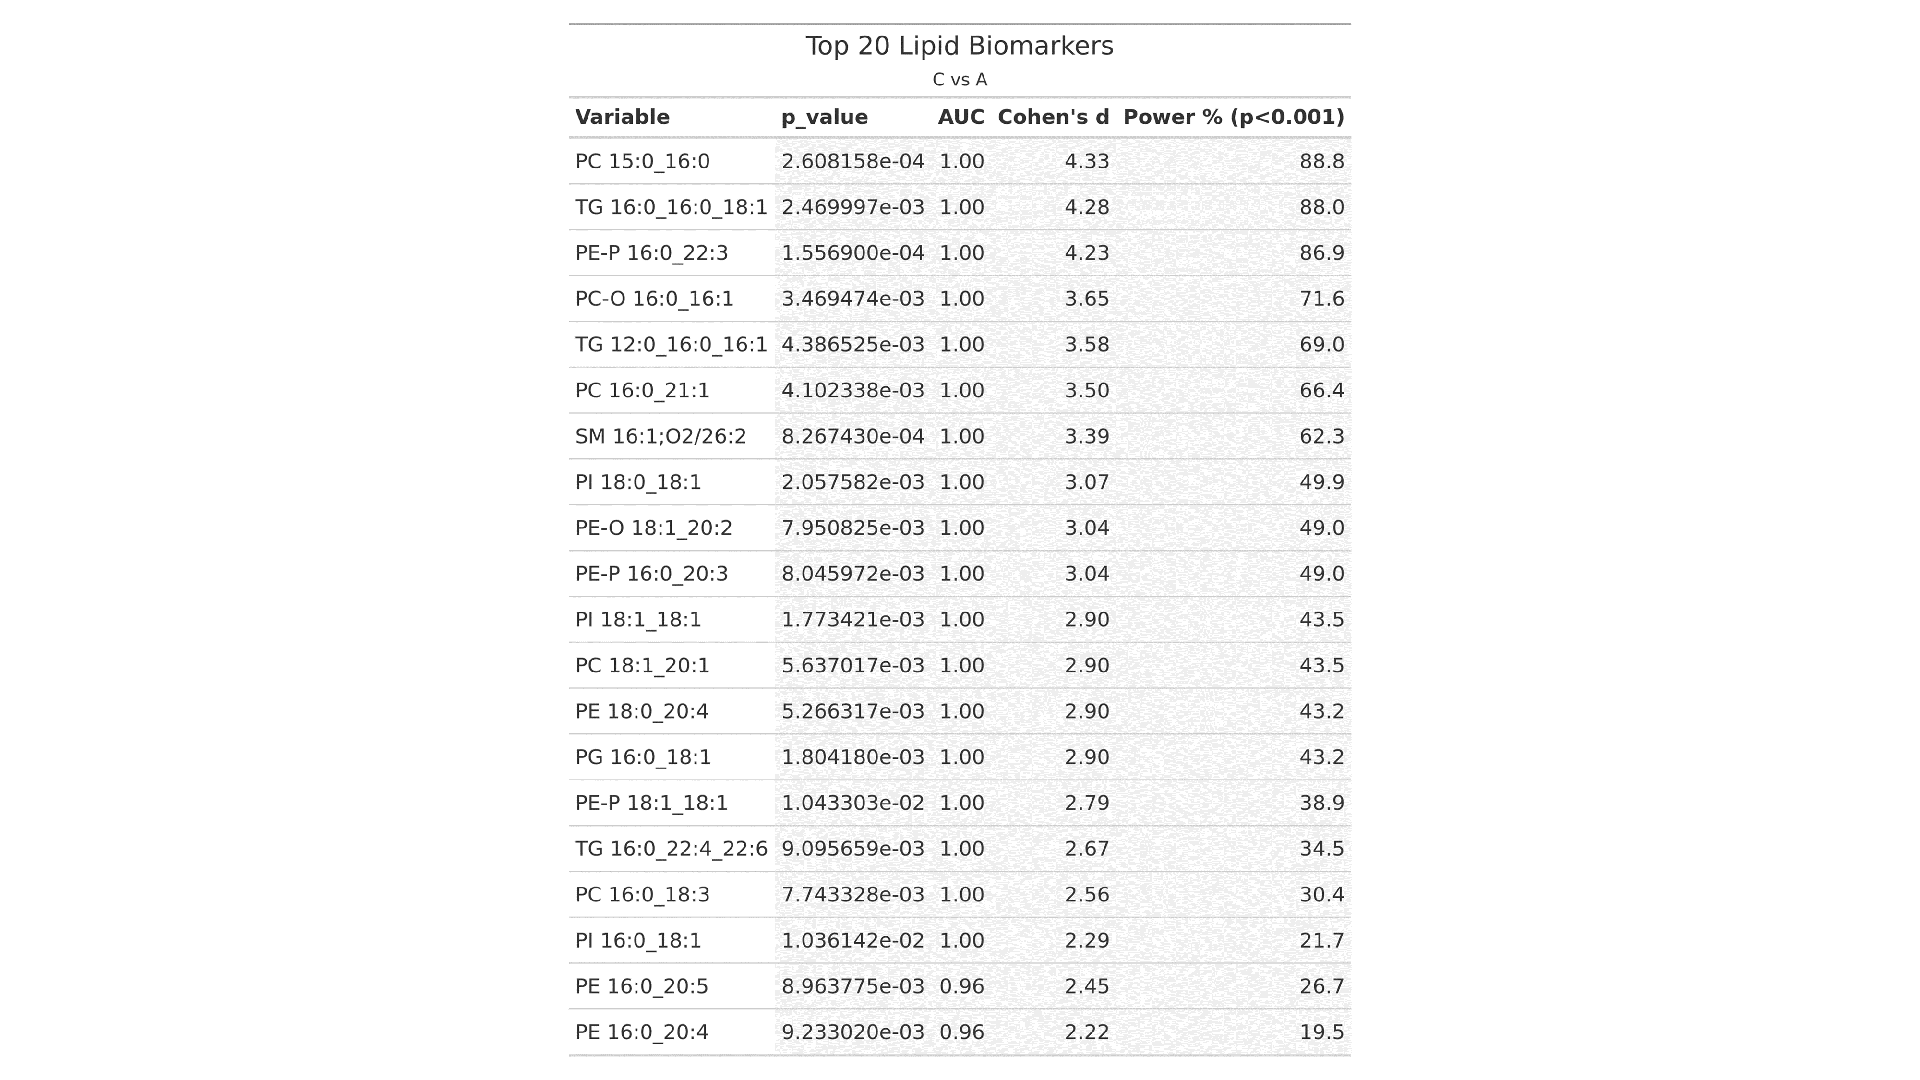
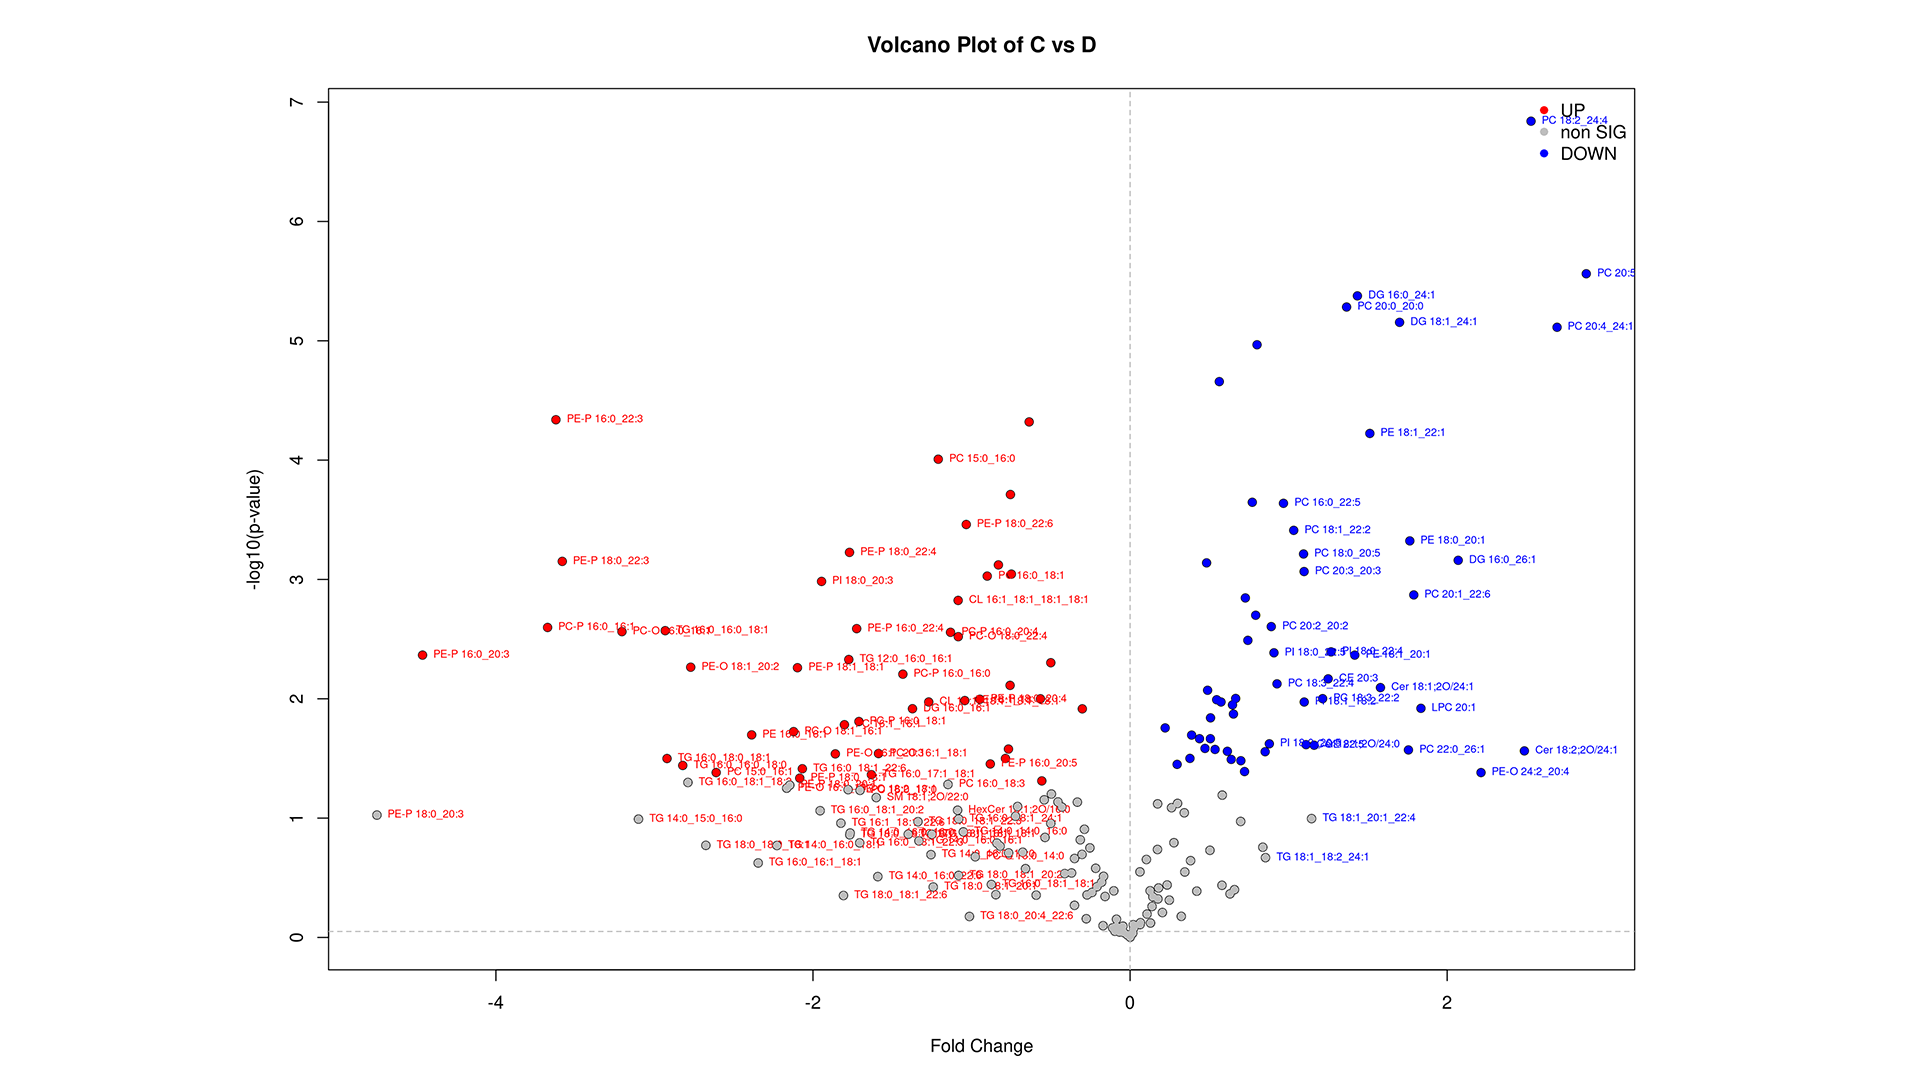
LipidOne enables biomarker discovery through multiple statistical approaches:
- Monovariate ROC Analysis: Evaluates the diagnostic performance of individual lipid species using AUC.
- Multivariate ROC Analysis (Random Forest Model): Assesses the combined predictive power of multiple lipid species.
- Candidate Biomarker Table: Lists the top 20 lipid biomarkers ranked by p-value, AUC, Cohen's d effect size, and statistical power, helping prioritize robust and clinically relevant candidates.
Functional Lipid Analysis turns complex lipid profiles into 42 biochemically-defined indices, highlighting functional shifts in energy, structural and signalling lipids between groups.
Each analysis result in LipidOne is accompanied by two key features:
- INFO Button: Provides a detailed explanation of the selected function, including its methodology and guidelines for interpreting the results.
- DOWNLOAD Button: Allows users to export high-resolution graphics and CSV tables, ensuring easy integration of results into reports and publications.
- Husam B R Alabed, Dorotea Frongia Mancini, Martina Pergola, Luigina Romani, Sabata Martino, Albert Koulman, Roberto Maria Pellegrino, Functional lipid analysis via index-based lipidomics profile: a new computational module in LipidOne, Bioinformatics, Volume 42, Issue 3, March 2026, btag090 https://doi.org/10.1093/bioinformatics/btag090
- Alabed, H. B. R., Mancini, D. F., Buratta, S., Calzoni, E., Giacomo, D. D., Emiliani, C., Martino, S., Urbanelli, L., & Pellegrino, R. M. (2024). LipidOne 2.4: A web tool for discovering biological meanings hidden in lipidomic data. Current Protocols, 4, e70009. doi: 10.1002/cpz1.70009
- Roberto Maria Pellegrino, Matteo Giulietti, Husam B.R. Alabed, Sandra Buratta, Lorena Urbanelli, Francesco Piva, Carla Emiliani, LipidOne: user-friendly lipidomic data analysis tool for a deeper interpretation in a systems biology scenario, Bioinformatics, Volume 38, Issue 6, March 2022, Pages 1767–1769, https://doi.org/10.1093/bioinformatics/btab867
- Garcia-Gimenez, A., Ditcham, J.E., Azazi, D.M.A. et al. CREBBP inactivation sensitizes B cell acute lymphoblastic leukemia to ferroptotic cell death upon BCL2 inhibition. Nat Commun 16, 4274 (2025). https://doi.org/10.1038/s41467-025-59531-6
- Michael G. Atser, Chelsea D. Wenyonu, Elyn M.et al., Pyruvate dehydrogenase kinase 1 controls triacylglycerol hydrolysis in cardiomyocytes, Journal of Biological Chemistry, Volume 301, Issue 4, 2025, 108398, ISSN 0021-9258, https://doi.org/10.1016/j.jbc.2025.108398.
- Volante, V.S.; Watson, F.L.; Bhattacharya, S.K. A Comparative Bioinformatic Analysis of Optic Nerve Axon Regeneration Lipidomes Using the Xenopus laevis as a Model System. Methods Protoc. 2025, 8, 110. https://doi.org/10.3390/mps8050110
- Amrutkar, M., Guttorm, S.J.T., Labori, K.J. et al. Reduced lipid metabolite abundance in human pancreatic cancer and matched serum samples following neoadjuvant FOLFIRINOX treatment. Metabolomics 22, 18 (2026). https://doi.org/10.1007/s11306-025-02388-z

- New data upload workflow: a redesigned input pipeline now detects the nomenclature level of your dataset and guides you through a smoother, more robust import—reducing formatting friction and making uploads more reliable across different lipidomics outputs.
- Chain Space: a new analysis view that projects your results into “chain space”, helping you quickly spot which acyl/alkyl chain signatures (e.g., unsaturation and chain-length patterns) drive differences between experimental groups.
- Functional Lipid Analysis: our innovative module for functional lipid profiling is now online. It calculates 42 functional indices, grounded in well-documented biochemical principles, to capture how energy, structural and signaling functions change between experimental groups.
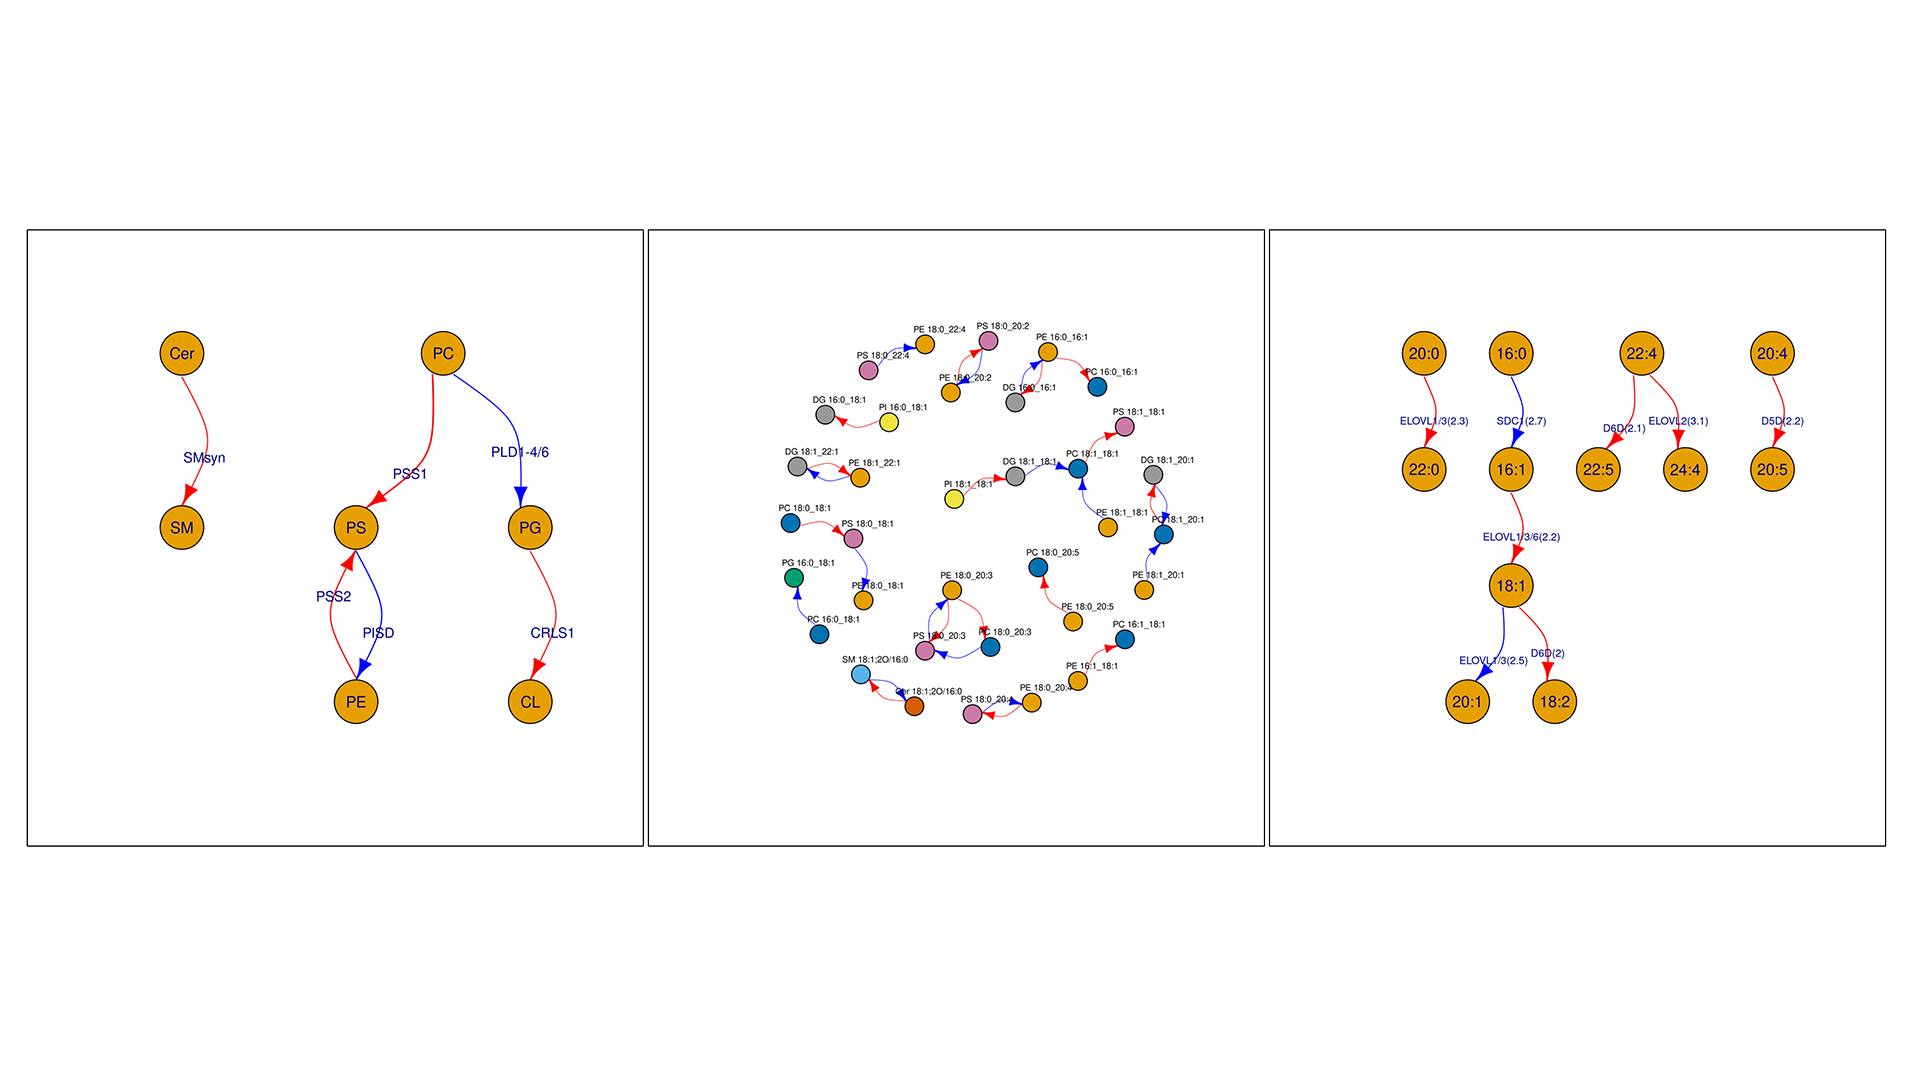
- Improved Predicted Proteins Network: a new network architecture better links lipid changes to their regulatory proteins, making it easier to move from lipid signatures to mechanistic hypotheses.
- PERMANOVA for lipid molecular species: a new function lets you test group differences directly on distance matrices, with support for covariates and blocking factors.
- Shorthand lipid translator upgraded: the utility now understands Thermo’s LipidSearch nomenclature, allowing LipidSearch users to feed their lipidomics tables directly into LipidOne.
- LipidOne on ELIXIR-IT: LipidOne is now hosted on the ELIXIR-IT infrastructure, offering faster analyses, higher uptime and seamless integration with other European bioinformatics services.
- LipidOne 2.1+ functions guide
manual (pdf file) - how to prepare your data
video tutorial (3 min) - how to prepare your data
manual (pdf file) - LipidOne 2.3
previous version - Poster "LipidOne"
presented at "Lipidomics Gordon Research Conference" Italy, May 5 - 10, 2024 (pdf file) - Poster Metabomeeting 2025
The British Library and The Francis Crick Institute, London, 16th – 18th December 2025 (pdf file)
Join the LipidOne research community and stay updated on the latest advancements in lipidomics! By subscribing to our newsletter, you will receive updates on new features, tools, and improvements designed to enhance your lipid analysis workflows.
No spam, just valuable content!
We respect your privacy – your email will never be shared, and you will receive at most one email every 4-8 months with relevant updates.Why subscribe?
- Get insights into the latest implementations and updates in LipidOne
- Stay informed about new lipidomics resources and analytical methods
- Be the first to know about upcoming features and opportunities for collaboration
Completed Jobs: 12147
1-100
101-200
201-300
301-400
401-500
501-600
601-700
701-800
801-900
901-1000
1001+
Jobs by country